

My primary research
My Gluten-Free Supermarket Study: 218 UK Foods GF vs GC
In my final year at university, I had to complete a scientific project for my dissertation. I decided to compare 109 gluten-free foods with their 109 gluten-containing twins. I spent months lining up these products in the same categories, with the same product types, and picking apart what actually differed between them.
Why Did I Do This Gluten-Free Supermarket Study
Firstly, because of the widespread health halo that gluten-free eating is healthier. Have you heard of it? Because I, as a gluten-free eater for over 10 years, have heard this a lot. So, what I wanted to know was simple: when a food gets reformulated to remove gluten, what else changes? Not the marketing on the front of the pack, the actual numbers. Protein, sugar, fiber, how processed it is, whether it’s fortified with the vitamins and minerals you’d normally get from wheat, and what it costs you at the till.
Most of my data came straight from supermarket websites, where I could pull nutrition labels, ingredient lists, and prices for every product. Aldi didn’t have the same level of detail online, so for their products, I took photos in-store and worked from those instead. Either way, every single number on this page came from a real product, not an estimate.
If you eat gluten-free, packaged substitutes are probably already part of your grocery basket: bread, pasta, cereal, crackers, baking mixes. The regular wheat version of these staples often comes with built-in fortification and a certain nutritional baseline. Swap to gluten-free, and you’re not just losing the gluten. You’re getting a different product, full stop. This page shows you what that difference actually looks like, based on 109 real pairs I checked myself.
I lean on this research a lot across DeGlutenista, especially when I talk about ultra-processed gluten-free foods. So consider this page the receipts. Every number you see quoted elsewhere on the site traces back to this page.
Research at a Glance: The Gluten-Free Supermarket Study
Research Figures
218
Products
8
Food categories
6
UK supermarkets
7
Nutrition values
%
Processing & Fortification
£
Cost
The other reasons behind this
Gluten-Free Supermarket Study
DeGlutenista
The health halo works on a simple idea: if a food avoids gluten, it must be doing you a favor nutritionally too. No, gluten is a protein that gives bread its stretch and structure.
Take it out, and a manufacturer has to rebuild that structure with something else. That “something else” is exactly what I wanted to see, ingredient by ingredient, label by label.
While packaging talks a lot about being gluten-free. It doesn’t say much about whether a product is fortified, how processed it is, or why it costs what it costs, especially when it sits right next to the regular version. So I built a straight matched comparison. For every gluten-free product, I found its matched regular equivalent and put them head-to-head.
Study products:
This page is only about the products, not about celiac disease or the gluten-free diet in general, just what’s actually in the box.
the comparison
109 Gluten-Free and 109 Regular Supermarket Foods
Picking and matching the products
I picked 109 gluten-free products across eight categories that people commonly swap: bread, pasta, biscuits and cakes, cereals, ready-to-eat products, crackers, flours, and baking mixes.
Then I matched each one with a regular version. Where I could, I matched within the same brand, so a brand’s gluten-free white bread went up against that same brand’s regular white bread. When a same-brand match wasn’t available, I picked the closest comparable option from the same supermarket, still matched by type, like gluten-free white sliced bread against a regular white sliced loaf.
Where the data came from
I pulled nutrition info, ingredient lists, fortification details, and prices from six major UK supermarkets, mostly through their websites, since that’s where the nutrition panels, ingredient lists, and prices were listed in full. Aldi didn’t have the same level of online detail, so for their products, I took photos in-store and worked from those instead.
What I compared on each product
For every product, I recorded energy, protein, total fat, saturated fat, total sugar, fiber, and salt, all per 100g so a small pack and a big pack were compared fairly.
Checking fortification
I checked whether each product had added calcium, iron, niacin, and thiamine. I picked these four because UK law requires them in regular (non-wholemeal) wheat flour. That gave me a fair yardstick: does the gluten-free version meet the same nutritional floor the regular product is legally required to hit?
Checking how processed each product was
I used the NOVA system, which groups foods by how much industrial processing went into them rather than by their nutrients. The most processed tier, Group 4, covers what’s usually called ultra-processed food: stuff reformulated with added industrial ingredients and additives. I put a product in NOVA Group 4 when its ingredient list showed signs of heavy industrial reformulation, things like cosmetic additives (added purely to fix texture, color, or shelf life) or starch, fiber, or protein isolates. These are the same markers I mean when I talk about a disrupted food matrix.
Comparing the price
I converted every price to cost per 100g so a large loaf wasn’t unfairly compared to a small one. Then I compared gluten-free versus regular, both overall and within each food category.
Making sure the differences were real
Once I had all the numbers, I didn’t just look at averages and call it a day. I ran proper statistical checks to determine which differences were big enough to be real and which were small enough to be down to chance. Anywhere I say a difference is significant on this page, that means it passed that check. Anywhere I say there was no real difference, that means it didn’t, even if the raw averages weren’t identical.
– Let’s see the results below:
What I Found: Nutrition, Processing, Fortification, and Cost
Gluten-Free Protein: How Much Lower Is It, Really?
Gluten-free products averaged 5.34g of protein per 100g. The matching regular products averaged 7.86g per 100g. That’s a real, significant gap, not just noise in the data. When a food is reformulated to remove gluten, protein tends to drop because gluten is a protein, and replacing it with starches leaves a gap.
Sugar in Gluten-Free Foods vs. Regular Foods
Gluten-free products averaged 2.90g of sugar per 100g, compared with 3.50g per 100g in the regular versions. This was also a real, significant difference. So in this sample, gluten-free wasn’t the higher-sugar option, contrary to what you might have heard elsewhere.
The Results:
The Findings About: Nutrition and Processing
Protein
Per 100g:
GF -5.34g · GC – 7.86g ·
GF products ran genuinely lower in protein. Gluten itself is a protein, so removing it and swapping in starches leaves a gap.
Sugar
Per 100g:
GF -2.90g · GC – 3.50g ·
Surprisingly, GF products were actually lower in sugar here, not higher, in this sample.
NOVA Group 4:
90.8% GF
78% GC
Both groups were mostly ultra-processed, but GF products were even more likely to be.
Ultra-Processed Gluten-Free Foods: The NOVA Results
90.8% of gluten-free products landed in NOVA’s most processed category, versus 78% of the regular products. Both numbers are high, which says something about the packaged staple aisle in general, gluten-free or not. But gluten-free products still came out more processed than their regular twins, which tells me going gluten-free tends to push a product further down the processing scale.
Additives and Isolates
Gluten-free products had more cosmetic additives and more starch, fiber, and protein isolates than their regular matches. These ingredients are added to rebuild the texture and structure that gluten would normally provide, which means the finished product’s structure has been reconstructed. It also lines up with the processing numbers above: gluten-free products in this sample needed more industrial help to hold together.
The Gluten-Free Fortification Gap
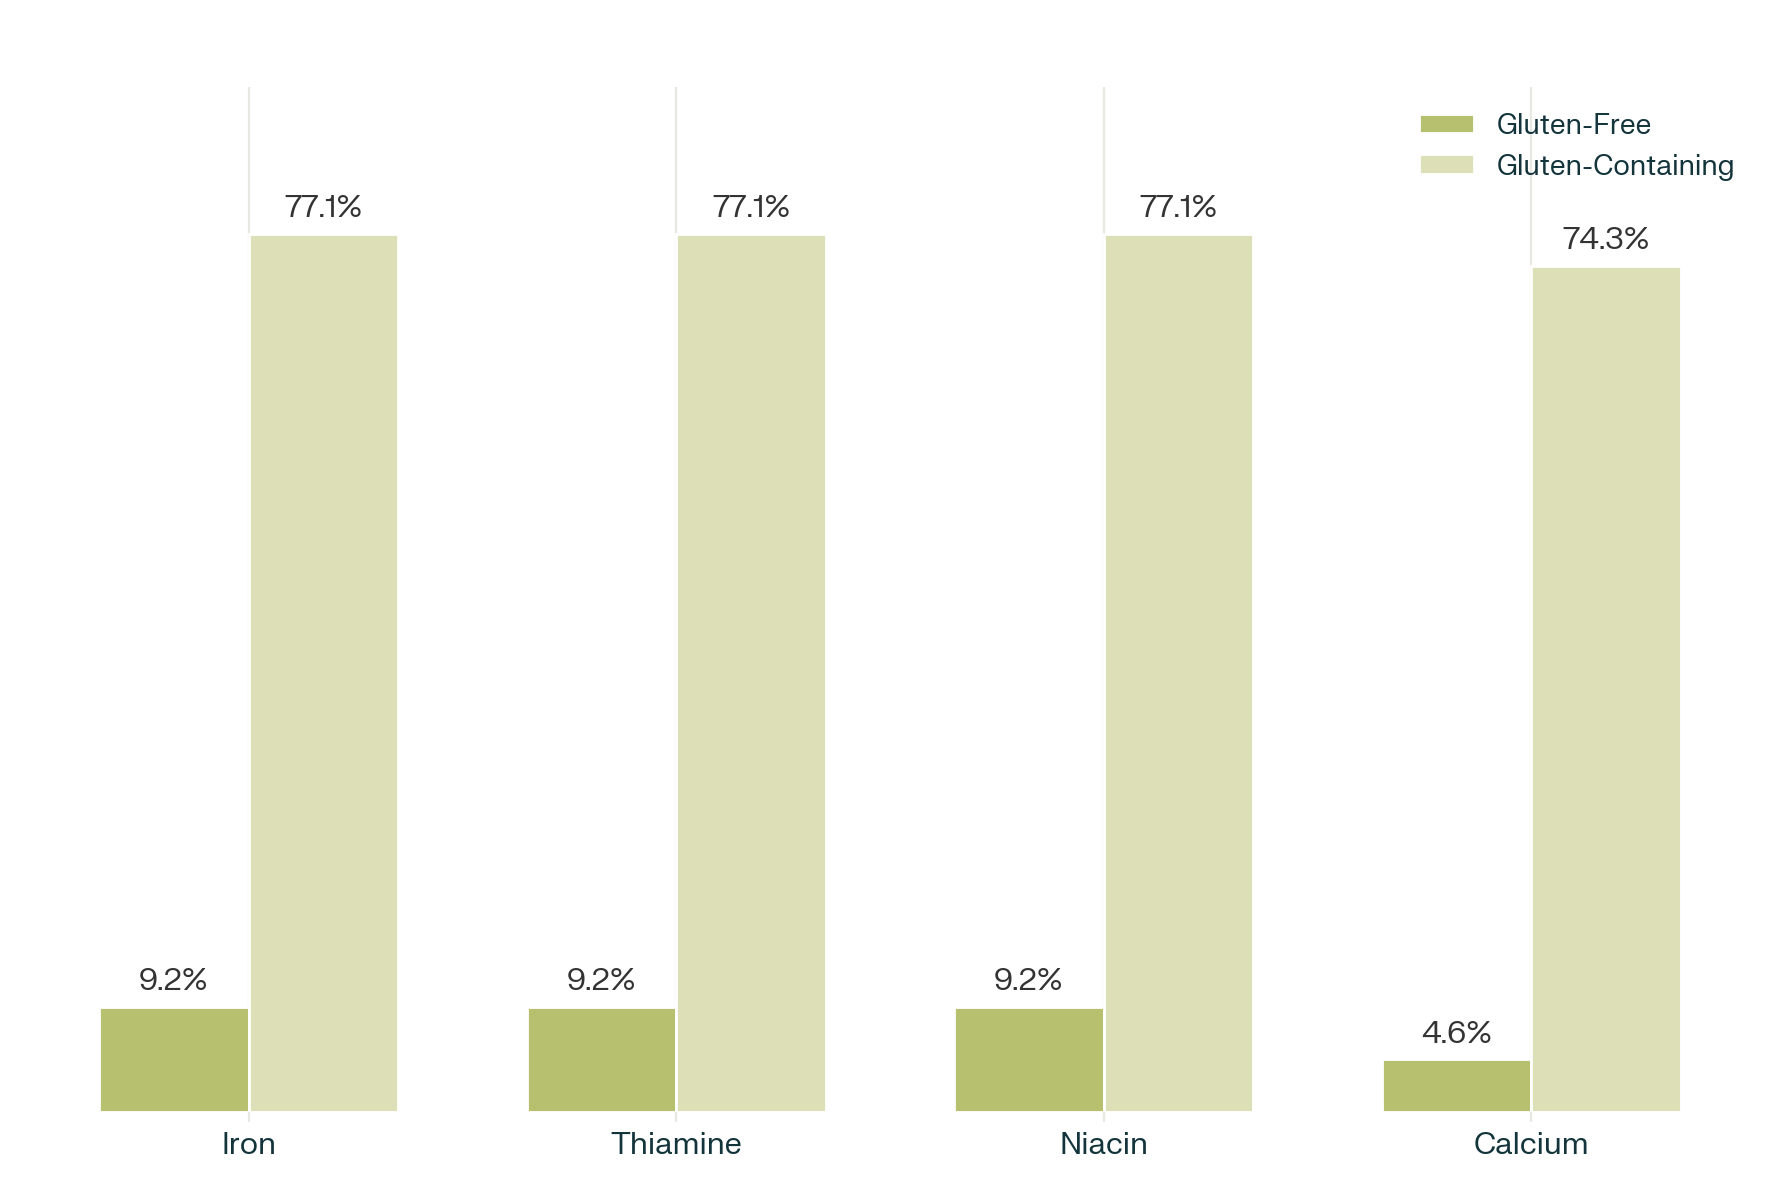
This surprised me most. In this gluten-free supermarket study, only 9.2% of gluten-free products had added iron, thiamine, or niacin, compared with 77.1% of regular products. Added calcium showed up in just 4.6% of gluten-free products, versus 74.3% of regular products.
In plain terms: the regular wheat products in this study were fortified almost as a rule, mostly because UK law requires it for wheat flour. Gluten-free products, made from different flours and starches, don’t fall under that same law, and the numbers show it. If you rely on gluten-free staples day to day, this gap is worth knowing about.
Fortification Gap
The Real Cost of Gluten-Free Bread and Staples
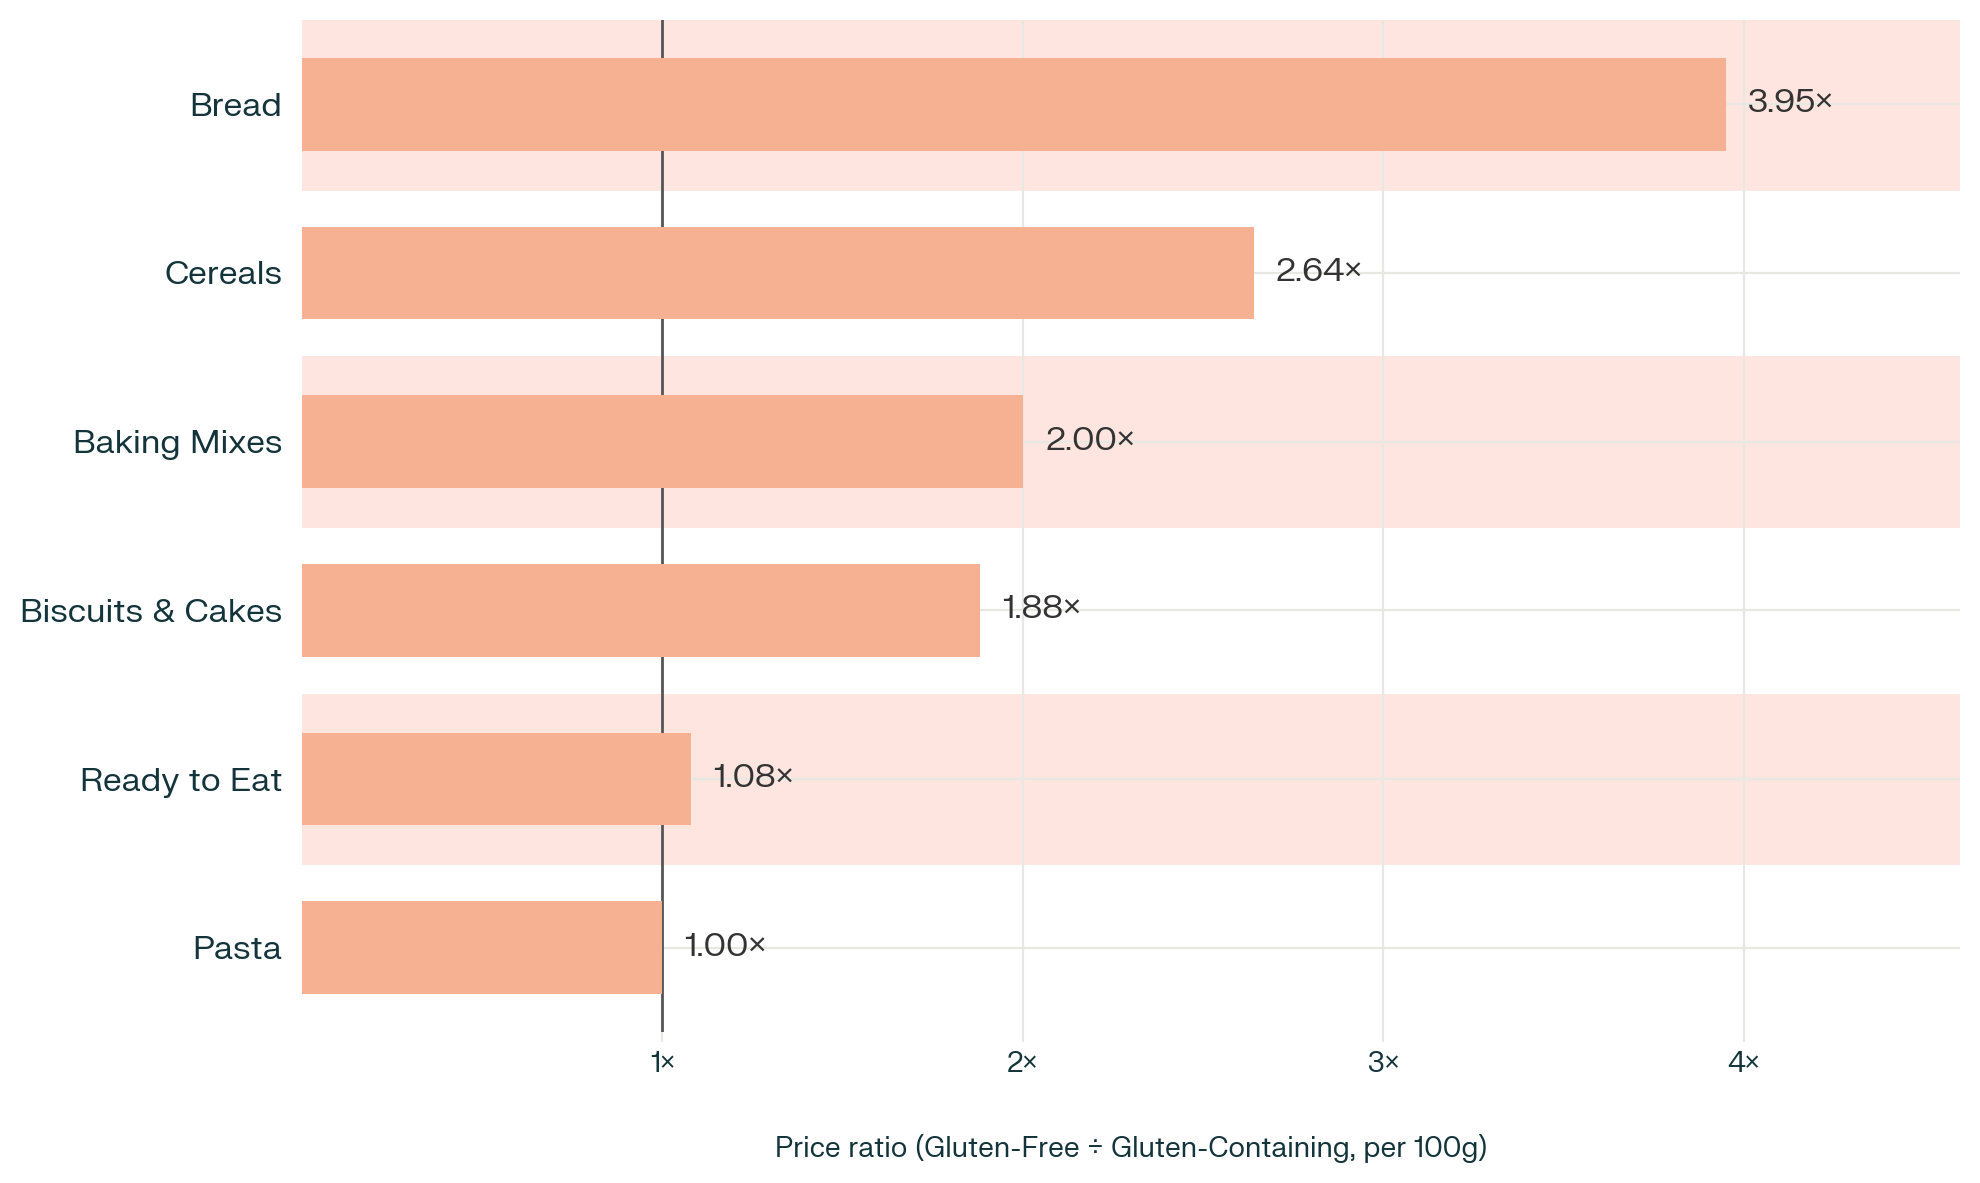
Gluten-free bread costs 3.95 times as much per 100g as regular bread. That’s one of the clearest, most consistent gaps in the whole dataset. Look at the graph below for the other categories.
Cost
The Food Matrix:
The Idea Beyond This Research
If you’ve read anything else on DeGlutenista and DaniSana, you’ve probably run into this idea already, because it’s the backbone of how I think about food, not just gluten-free food. It’s called the food matrix, and it’s honestly the part of my dissertation I added as a literature gap.
A food isn’t just a list of nutrients on a label. It’s a structure. In a whole grain, whole oat, or an intact piece of fruit, the protein, fiber, starch, and fat are physically bound together in a specific way, and that structure affects how your body actually digests and absorbs what’s inside it. Two foods can have identical numbers on a nutrition panel and still behave differently in your body, because the structure holding those nutrients together isn’t the same.
Here’s what I pointed out in this study. When a product is reformulated, whether that’s to remove gluten or for any other reason, manufacturers often rebuild it using isolates- protein isolate, fiber isolate, starch isolate– plus additives to fix the texture back up. That process reconstructs the food, but it doesn’t necessarily reconstruct the food matrix. Pulling a nutrient out of its natural structure and adding it back in isolated form doesn’t give you the same food you started with, even if the label says otherwise.
After my primary research in a gluten-free supermarket study, I no longer see “gluten-free” as a single nutrient swap. It’s why this whole study looks at ingredient lists and processing level alongside the numbers on the nutrition panel. The extra additives and isolates I found more often in gluten-free products in this study aren’t just extra lines on an ingredient list. They’re a sign of a food matrix that’s been taken apart and put back together, and that’s a genuinely different thing to eat than the whole-food version it’s standing in for.
Fiber, Salt, and Saturated Fat: Where Gluten-Free Foods Matched Up
However, energy, fiber, saturated fat, and salt, gluten-free and regular products were close enough that the difference wasn’t statistically significant. So if you’ve heard that gluten-free food is automatically saltier or higher in saturated fat, this data doesn’t back that up. Across these four measures, the two groups appeared quite similar, suggesting that food manufacturers are starting to respond to consumer demand for healthier gluten-free options, with more products likely on the way.
What This Means for Gluten-Free Shoppers
None of this means packaged gluten-free food is a poor choice, and that’s genuinely not where I’m going with this. Convenience is real. Some days a gluten-free loaf or a box of crackers is exactly what you need, and that’s completely fine.
This study tells me that the words “gluten-free” on a label don’t tell you much on their own. Two products can both say gluten-free and be worlds apart in protein, fortification, and processing. Based on what I found, here’s what I’d actually glance at on a label:
- Protein, since gluten-free versions in this sample ran lower on average
- Added calcium, iron, niacin, or thiamine, since fortification was far less consistent on the gluten-free side
- The ingredient list, since more additives and isolates usually mean a more reconstructed and reformulated product
- Fiber, since gluten-free grains vary a lot even though this study found no overall gap here
- Price per 100g, since staples like bread carried a real premium
My own approach is to build meals around foods that keep their natural structure intact, and treat packaged gluten-free products as one tool I reach for sometimes, not the default. This research, and the food matrix concept behind it, is a big part of why.
What This Gluten-Free Food Study Can’t Tell You
This was a snapshot: I gathered this data during a specific window, so it reflects what was on the shelf and online then, not an ongoing average. Supermarkets change and reformulate products all the time so that some individual products may have shifted since.
This compares products, not diets or health outcomes. It shows real differences in what’s in the pack, how processed it is, whether it’s fortified, and what it costs. It doesn’t show that eating any specific product causes a health problem, and it wasn’t set up to prove that.
I looked at eight staple categories from six major supermarkets. That’s a solid sample, but it doesn’t cover every gluten-free product out there, independent brands, online-only products, or markets outside the UK. So these findings describe this sample, not “all gluten-free food everywhere.”
Where This Gluten-Free Nutrition Research Appears on DeGlutenista
I lean on this research across the site, especially in articles about ultra-processed gluten-free foods, protein gaps on a gluten-free diet, fortification and nutrient shortfalls, the real cost of eating gluten-free, and label and ingredient comparisons. Wherever you see a specific number from this study quoted elsewhere on the site, it comes back to this page.
Academic Details Behind This Gluten-Free Food Research
Title: A Comparative Analysis of Processing Level, Nutritional Composition, and Cost: Gluten-Free versus Gluten-Containing Packaged Foods in the UK Supermarkets
Author: Yordanka Ivanova Markova
Degree: BSc (Hons) Human Nutrition First Class
Date: April 2026
Sample: 218 packaged products (109 matched gluten-free/gluten-containing pairs) across 8 food categories from six major UK supermarkets
Keywords: gluten-free foods; ultra-processed foods; food fortification; gluten-free food cost; food matrix; coeliac disease
This is an original undergraduate dissertation research, not a peer-reviewed published study, completed as part of a BSc (Hons) Human Nutrition degree.
All results table
| What I compared | Gluten-free (GF) | Regular (GC) | Real difference? | What it means |
|---|---|---|---|---|
| Protein (per 100g) | 5.34g | 7.86g | Yes, significant | GF products ran genuinely lower in protein. Gluten itself is a protein, so removing it and swapping in starches leaves a gap. |
| Total sugar (per 100g) | 2.90g | 3.50g | Yes, significant | GF products were actually lower in sugar here, not higher, in this sample. |
| Energy (per 100 g/kcal) | 293 | 302 | No | Close enough that the gap wasn’t statistically real. |
| Fiber (per 100g) | 2,30 | 2.50 | No | No real difference found between GF and GC products on fiber. |
| Saturated fat (per 100g) | 1.00 | 1.20 | No | No real difference found between GF and GC products. |
| Salt (per 100g) | 0.56 | 0.60 | No | No real difference found between GF and GC products. |
| NOVA Group 4 (ultra-processed) | 90.8% | 78% | Yes | Both groups were mostly ultra-processed, but GF products were even more likely to be. |
| Fortified with iron, thiamine, or niacin | 9.2% | 77.1% | Yes | Regular products were fortified almost as standard, largely due to UK flour fortification law. GF products mostly weren’t. |
| Fortified with calcium | 4.6% | 74.3% | Yes | Same fortification gap, this time on calcium specifically. |
| Cosmetic additives, starch/fiber/protein isolates | Higher | Lower | Yes | GF products showed more signs of a rebuilt food matrix, ingredients used to reconstruct texture and structure. |
| Bread price (per 100g) | 3.95x the cost | Higher | Yes | GF bread cost close to four times as much as regular bread, per 100g. |